Brewing a Better Connection Reimagining the Frontline Employee Feedback Experience
Redesigning the feedback ecosystem for a global food & beverage leader to amplify the voices of its 400,000+ store employees and drive data-informed innovation.

My Role
Product Designer,
UX Researcher
Owned strategy, mixed-method research, concept design, and pilot validation
Skills Involved
User Research
Product Strategy
Innovation Implementation
Visual Design
Rapid Prototyping
Timeline
12 Weeks
The Challenge
A Disconnected Voice
A global coffee leader was launching new in-store initiatives but lacked critical feedback from its frontline employees.
The company's primary feedback tool, a digital survey, had very low 5% response rates, leaving them blind to operational issues.
The challenge was to find root the cause of the low engagement and design a solution to capture the invaluable insights being lost.
Impact highlights
From 5% → 60% Increase
Reframed the problem from a simple survey issue to a systemic user experience challenge, delivering a 3-phased innovation roadmap.
We developed and tested initial intervention prototypes across 4 districts in USA, culminating a holistic feedback concept.
The most successful pilots resulted in a 60% increase in employee engagement, validating our hypothesis and securing stakeholder buy-in for the long-term vision.
1.6X Increase
Lift in employee engagement in the top-performing pilot, increasing responses by fixing the feedback gap preventing expensive losses in the future.
96% Willing
Partners were comfortable providing feedback, proving the issue was a systemic UX failure, not user apathy.
1 in 4 Partners
Ratio of employees who explicitly demanded to see their feedback lead to tangible action, a core insight from analyzing 278 open-ended responses.
Why this mattered

The company validates hundreds of in-store innovation before national rollouts. The existing Partner Pride Survey had a 95% non-response rate, leaving product decisions supported by an extremely small and biased sample. That gap created systemic risk: a failed national rollout could represent nine-figure losses.
Research-driven insights
This project prioritized grounding every design decision in partner reality. The research program used a mixed-method approach that combined field observation, contextual interviews, qualitative coding, and analysis of existing survey responses to triangulate root causes.


Filling out the survey is just one small part of the whole survey experience
Barriers
Designing a better survey is the least of our concerns. Drawing from two surveys with 278 combined responses and our qualitative research, we categorized the barriers by their level of significance.
Accountability
No way to keep track of
the store progress
TIme
Difficult to find time to take the survey
awareness
Limited awareness & communication
Cognitive
Struggle to remember to take the survey
motivation
Insufficient intrinsic motivational
access
Difficult access & navigation to the survey
Context
Lack of understanding and context
UX
survey experience
We asked how likely would store partners take a survey if this aspect was improved, and measured the frequency of responses. We triangulated the results with observations from the comparative testing, store visits, qualitative interviews, and open-ended survey answers.
Hypotheses
01
Making survey access visible and centralized will reduce friction and increase completion.
02
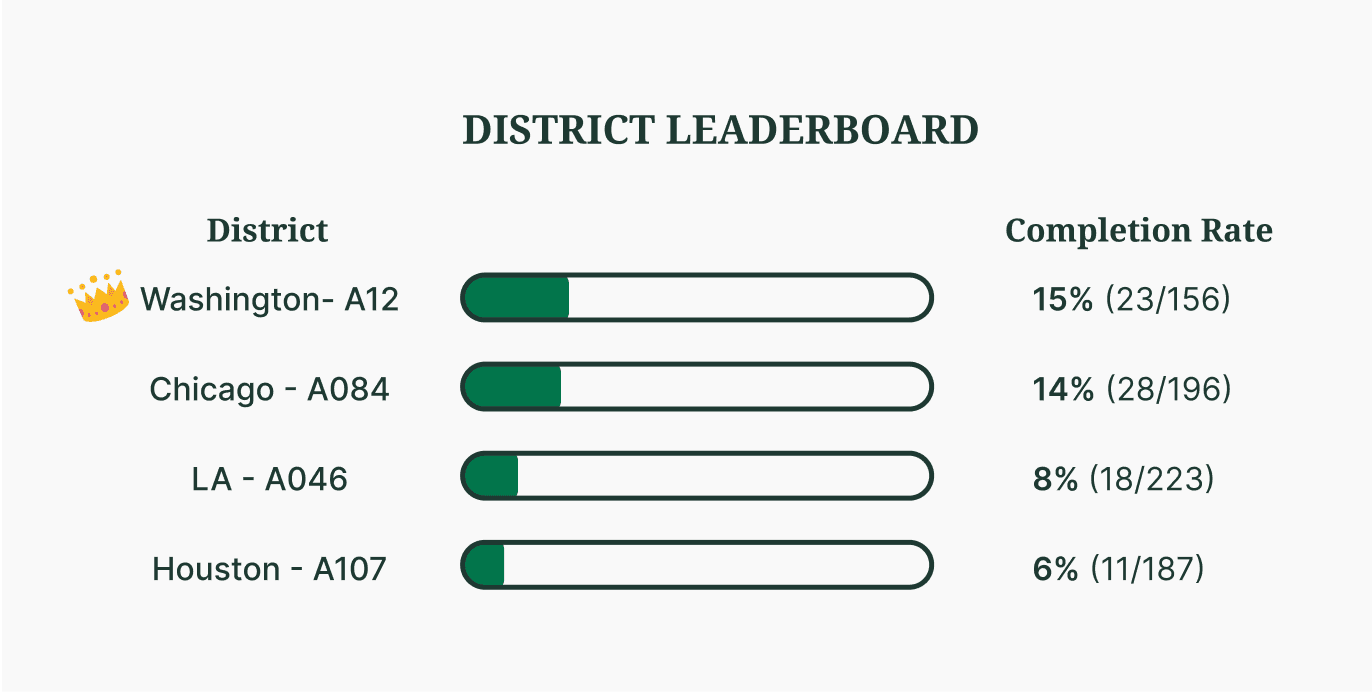
Adding a social, competitive signals (store/district leaderboards) will increase motivation and completion among partners.
03
Closing the loop (showing what changed) will improve repeat engagement and perceived value.
Each pilot targeted one or more hypotheses so results could be triangulated back to specific mechanisms.
Testing Hypotheses


Design of the pilots
We intentionally chose low-cost, observable interventions (physical posters with QR codes, updated shift comms, a district leaderboard in a shared Teams channel, and scripted manager prompts).
Pilots were run as quasi-experiments across four Store Testing Team districts with consistent measurement windows and a control period baseline.
Outcomes
2 districts implementing gamification + improved access saw a 60% uplift in completion.
2 districts saw declines attributed to confounding variables (technical issues and survey fatigue), a critical learning that informed rollout readiness.
Combined uplift equated to 12x improvement over the baseline in the successful pilots.
What we measured
Primary metric
Survey completion rate
Secondary signals
Qualitative sentiment
Anecdotal indicators
Solution overview
Espressit is a centralized feedback platform concept designed to solve the three root causes. It bundles three tightly-focused features:

Transparent Feedback Loop

Post-survey completion splash screens and summaries so partners can see tangible results from participation.
Centralized To‑Do Hub

Single place to see active tests, who’s responsible, and remaining time to complete the task, reducing fragmentation.
Gamified Dashboards

Store and district level progress metrics, streaks, and leaderboards to replace manual motivating with friendly competition. (Manager validation: strong.)
Risks & limitations
01
Two pilot districts underperformed due to tech issues and fatigue, underscoring the need for telemetry and staged rollout.
02
Low-fi pilots are context-sensitive; transferability requires local tailoring.
03
Early stakeholder alignment was critical to scaling.
Learnings
Business outcomes & stakeholder impact
Pilot data created a defensible case for the need to invest in a dedicated feedback channel, shifting budget conversations from speculative to evidence-driven.
Surfaced the previously invisible partner voice at scale, improving confidence in test outcomes and reducing rollout risk.
Next steps
Build the prototype
of Espressit MVP